Maps and Data


In community change work, we are often called upon to use various kinds of data for different circumstances—to assess community conditions, monitor trends, prioritize areas for investment, and more. In place-based work, it’s often useful to explore geographic data and when possible, data displayed on maps. This channel is designed as a guide for changemakers to learn about when and where to use data in their workflow, and to provide guidance around using and interpreting data to inform community change work, as well as sharing data with community partners and stakeholders. 


Best practice when using data to drive community change is to use a combination of primary and secondary data to paint a fuller picture of a given community. Secondary data are often quantitative in nature and refer to data collected by someone other than the primary user. Common secondary data sources include censuses, other government agencies, large projects or organizations (e.g. County Health Rankings, Opportunity Insights), and academic research centers (e.g. Institute for Health Metrics and Evaluation), among others. Primary data are data collected by the user, often through community surveys, focus groups, in-depth interviews, community dialogues or conversations, among others.


It’s important to use data in context, especially when using it to inform efforts to advance equitable community well-being. Data in context values people-centered, multi-solving approaches that start with shared sense-making and uses maps, visualizations, and community voices to strengthen data access and understanding. We believe that communities are the experts in their own experiences and deserve to have access to their own data. We believe data in context is an opportunity to build shared language and understanding to catalyze community change and we advocate for spotlighting stories of people with lived community experience alongside data, because it’s the corresponding stories and framing narratives that humanize statistics, draw people in, and prompt action. 


Maps and Data Channel Categories


These resources and tools provide helpful guidance around using and interpreting data and maps for community change work. This is a great place to start for community data skill-building—you’ll find descriptions of foundational concepts, tips and tricks, and emerging and innovative tools and resources for using data to drive and inform your work.

Search on Community Commons for:  Data Modeling  |  Program Evaluation  |  Surveillance and Monitoring


    Foundational Concepts

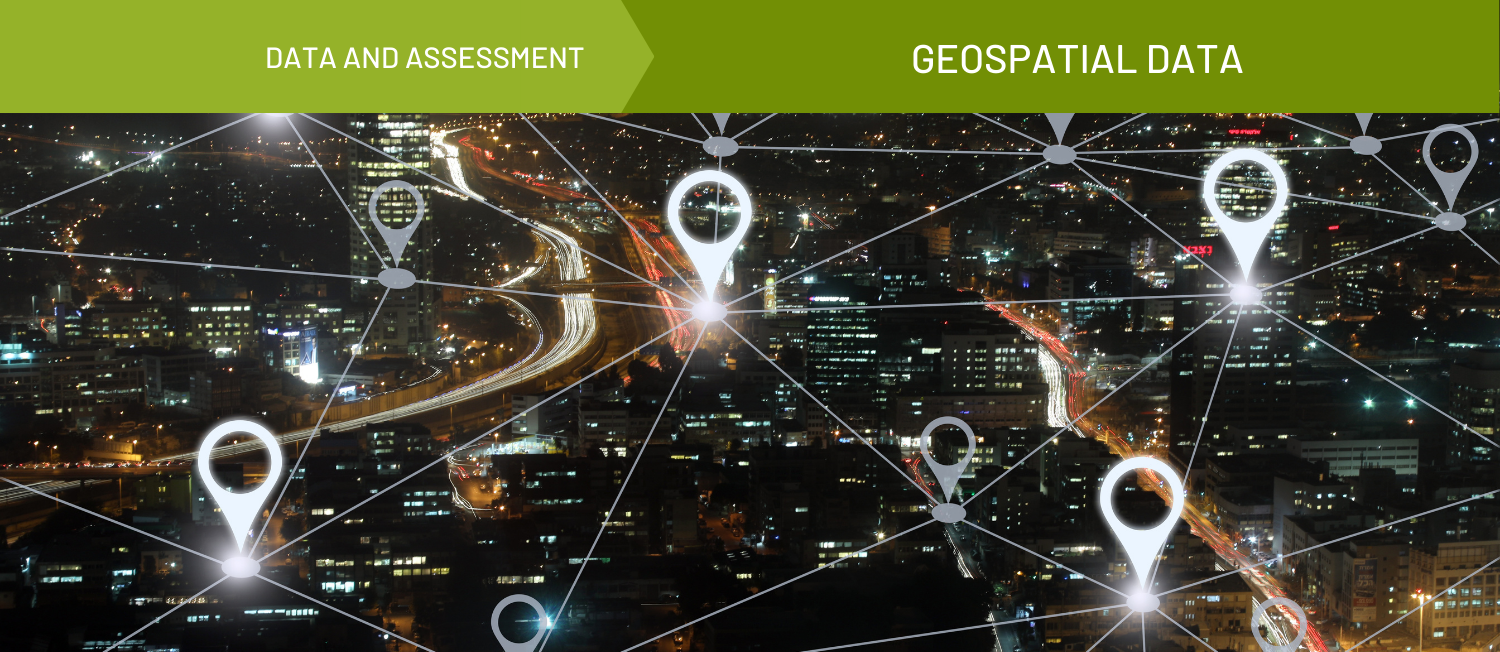
    A graphic depicting location-specific data points. A green banner that spans the top of the image reads
    Geospatial Data
    Topic - Data & Assessment
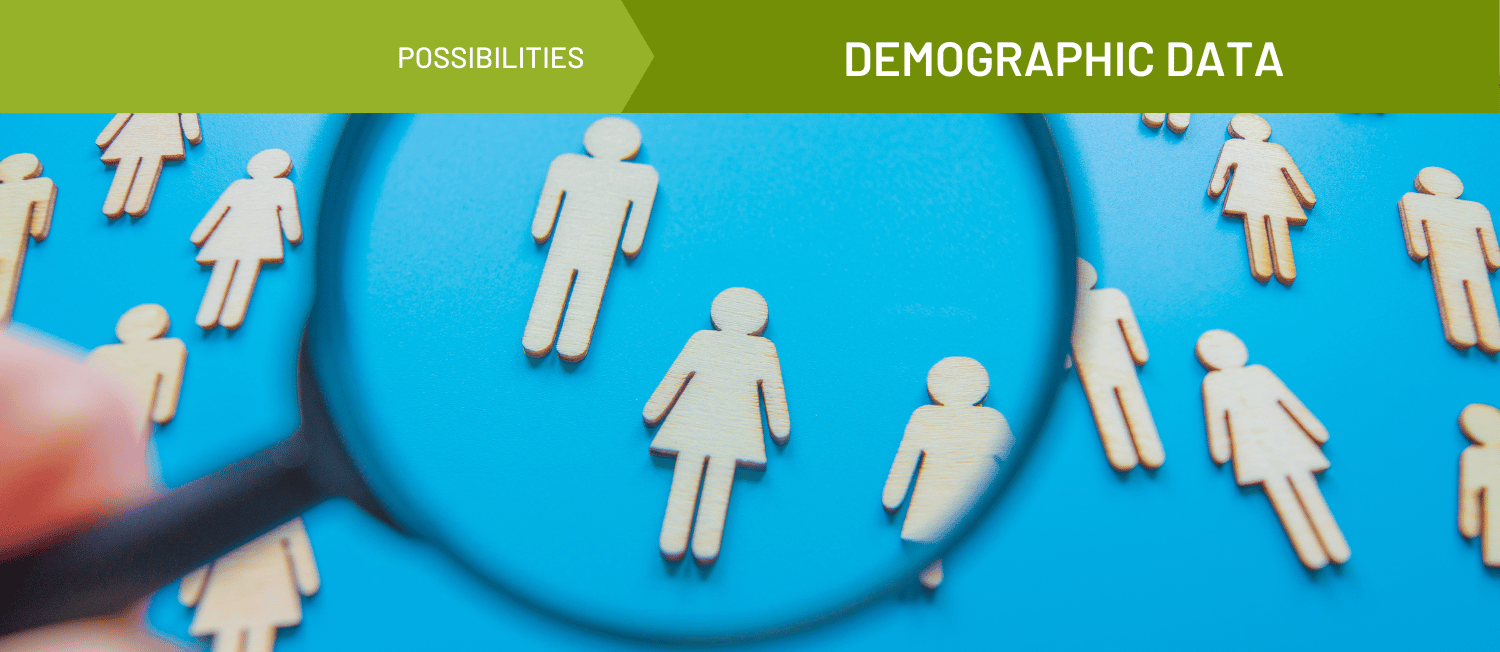
    Photo of of a magnifying glass examining various stick figures. A green banner spans the top of the photo and contains white text that reads
    Demographic Data
    Topic - Possibilities
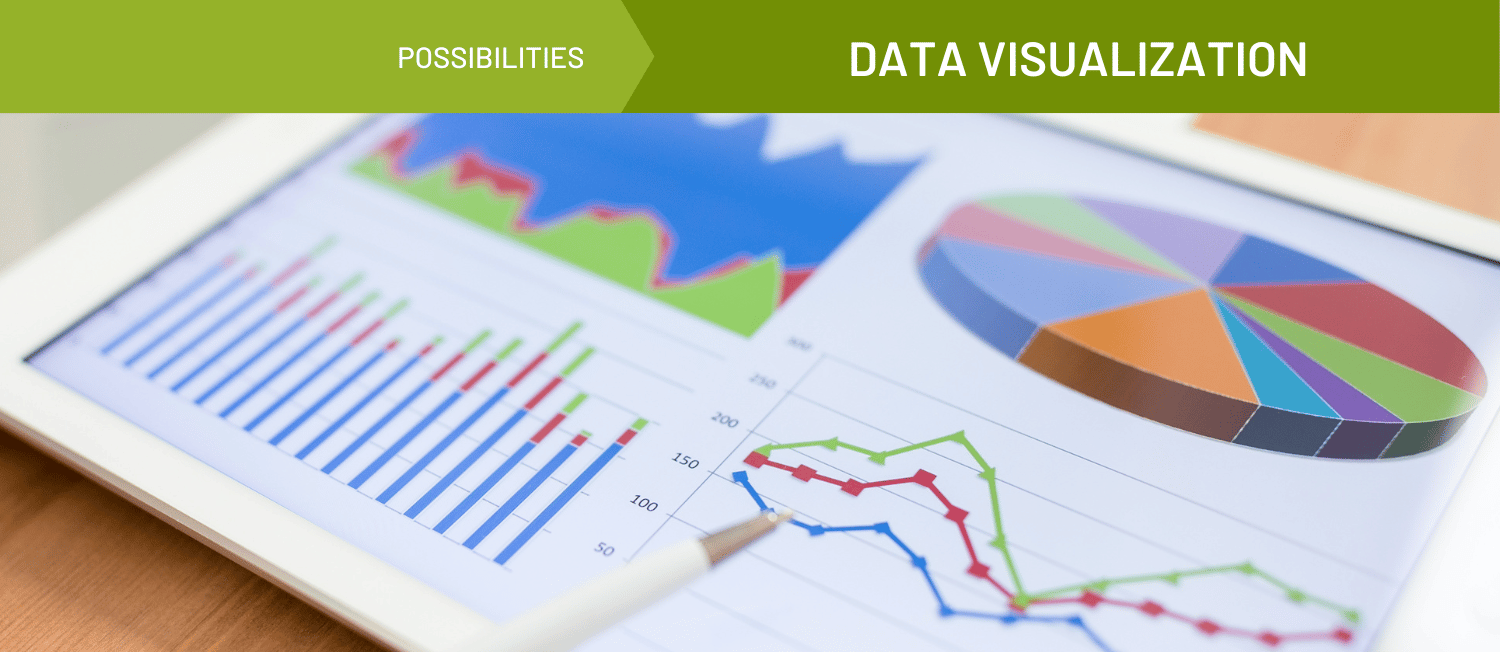
    Photo of charts and graphs. A green banner spanning the top of the image contains white text that reads
    Data Visualization
    Topic - Possibilities
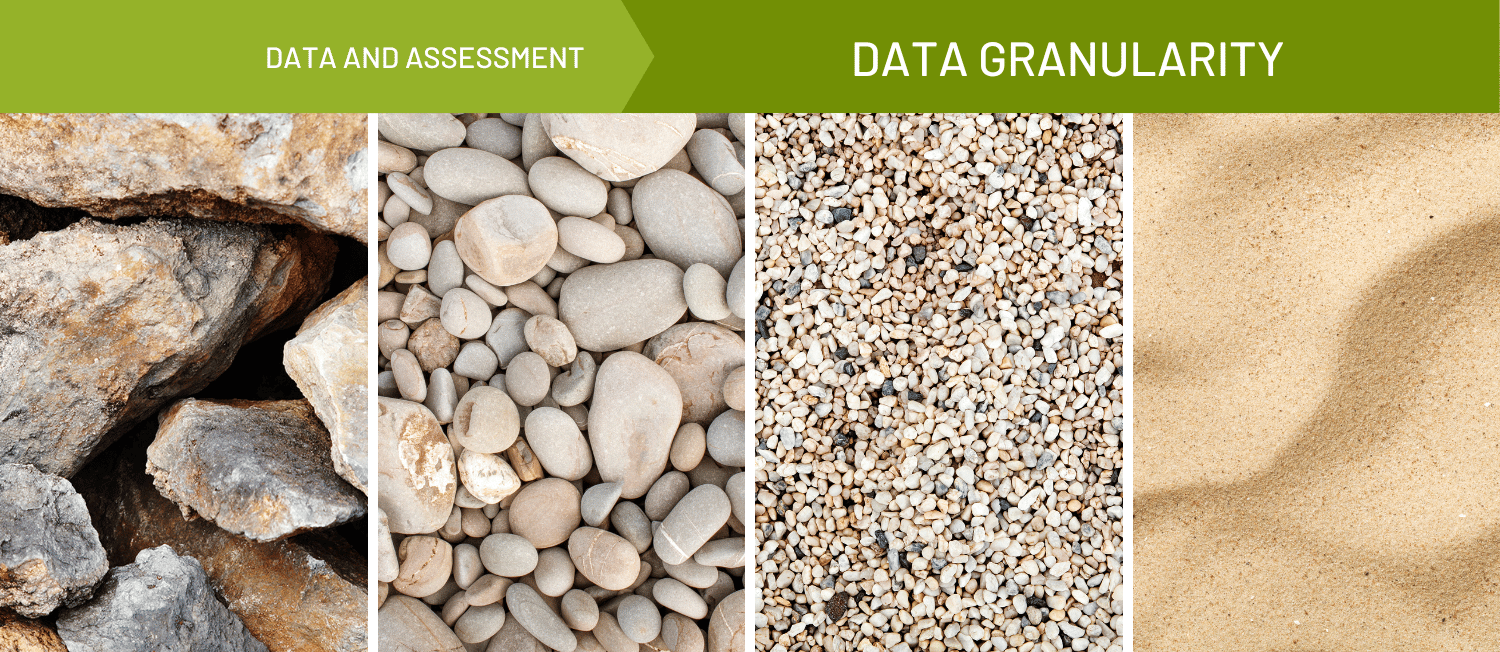
    A collage of four images of rocks, each getting progressively smaller in size. A green banner spanning the top of the image reads
    Data Granularity
    Topic - Data & Assessment
    of photo of a person or persons split into six sections with coding or data overlays
    An Introduction to Data Equity
    Story - Original
    Brought to you by Community Commons


    Foundations for Community Health Data Users Series

    Rectangles contain titles that read
    Tracking Trends in Population Health Over Time
    Story
    Brought to you by IP3
    Published on 12/13/2022
    Rectangles contain titles that read
    Understanding and Interpreting Population Health Measures
    Story - Written
    Brought to you by IP3
    Published on 11/15/2022
    Rectangles contain titles that read
    Refreshing Data Basics
    Story
    Brought to you by Community Commons
    Published on 05/30/2023
    Rectangles contain titles that read
    Using Benchmarks to Explore Population Health Data
    Story
    Brought to you by IP3
    Published on 08/23/2022
    Rectangles contain titles that read
    Disaggregating Population Health Measures
    Story
    Published on 10/19/2023


      These resources and tools provide explanation and guidance around various methods for qualitative and quantitative data collection. Learn about the different methods, how to select the best method(s) for your project, and discover practical tools to get started collecting data in the field.


      Search on Community Commons for:  Community Listening Sessions  |  Key Informant Interviews |  Geographic Data |  Community Asset Mapping  |  Data Collection vs Data Sourcing


      Screen shot of article photo: Indigenous Evaluation
      Indigenous Evaluation
      Resource - Website/webpage
      colorful graphic image of a brain Image by Gerd Altmann from Pixabay
      The Science of Thriving
      Story - Original
      Brought to you by Community Commons
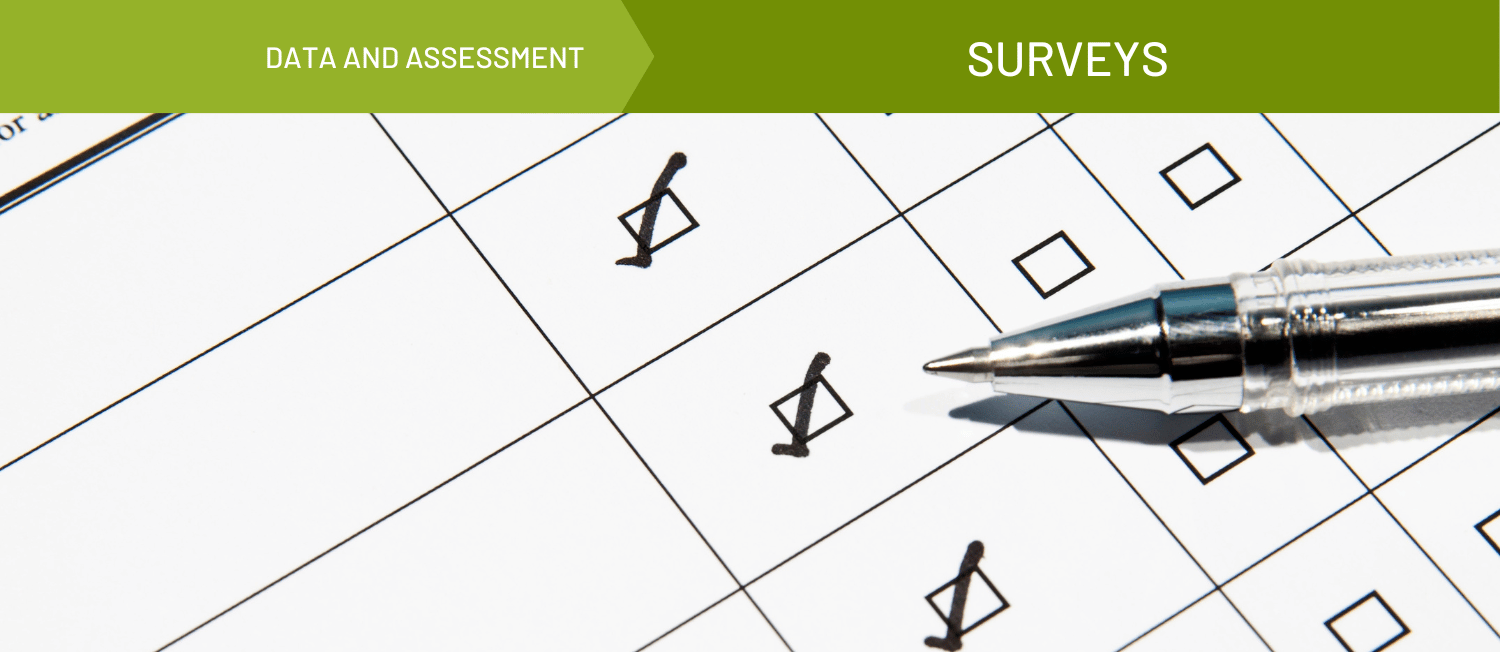
      A photo of survey being filled out on paper with a pen. A green banner spans the top of the image and reads
      Surveys
      Topic - Data & Assessment
      A photo of a focus group. A green banner spanning the top of the image reads
      Focus Groups
      Topic - Data & Assessment
      A photo of files in a filing cabinet. A green banner spans the top of the image and reads
      Administrative Data
      Topic - Data & Assessment
      Collage of portraits from 100 Million Healthier Lives movement
      Engaging People with Lived Experience Toolkit
      Tool - Toolkit/toolbox
      Brought to you by 100MHL
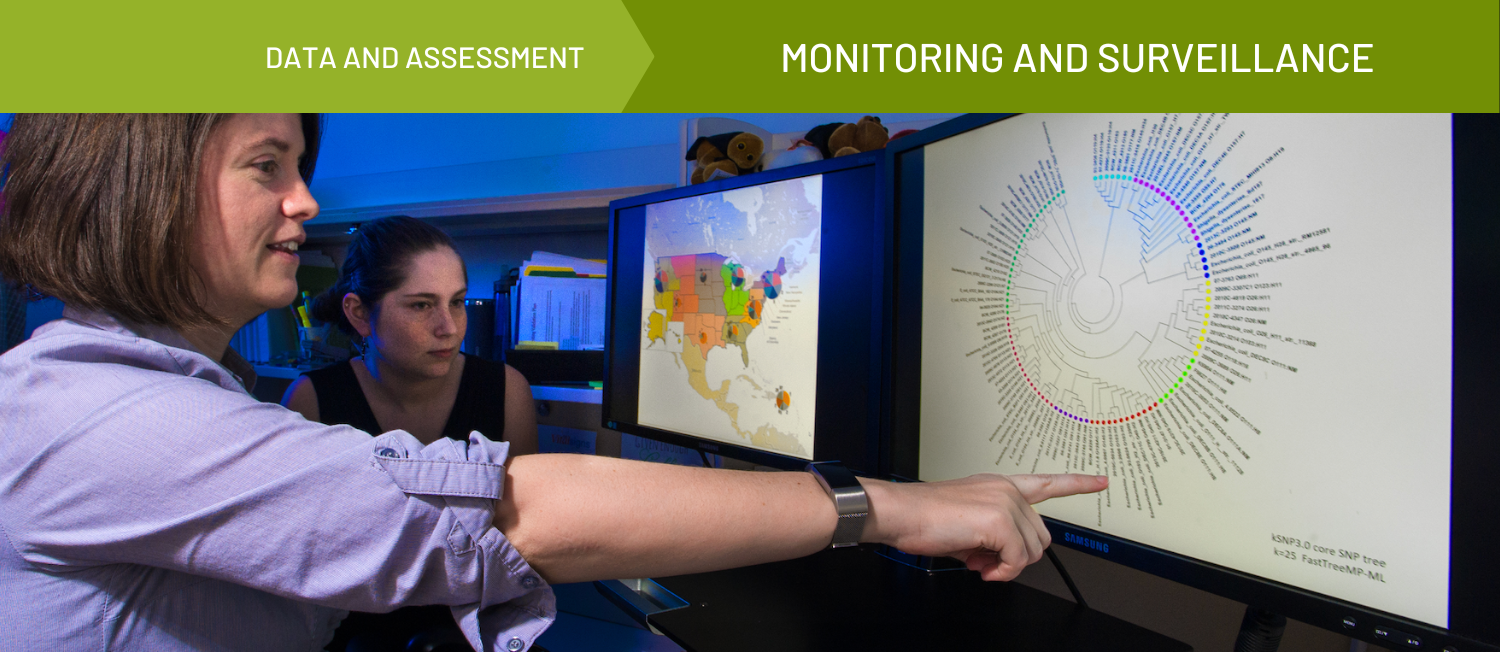
      A photo of scientists comparing bacterial whole genome sequencing data collected from a multistate foodborne outbreak. A green banner that spans the top of the image and reads:
      Monitoring and Surveillance
      Topic - Data & Assessment


      Community Assessment

      A photo of three people having a discussion in a community meeting. A green banner that spans the top of the image reads
      Community Health Needs Assessment
      Topic - Data & Assessment
      Photo of a person writing on large pieces of paper. A green banner spanning the top of the image reads
      Community Health Improvement Plans
      Topic - Data & Assessment
      People at a post it board. Green banner reads
      Community Needs Assessment
      Topic - Possibilities
      A collage of photos of people and community members, each with a different color overlay.
      An Introduction to Community Health Needs Assessment (CHNA)
      Story - Original

      Brought to you by Community Commons
      Published on 09/19/2023


      Health Impact Assessment


      Discover publicly-available online data sources and datasets where you can access data for your community today. Explore web-based data tools, maps, models, and more to support using data to inform strategies to advance equitable well-being.


      Search on Community Commons for:  National Data Tools  |  Data Sources  |  Datasets |  Data Sources for Community Change Work


      Staff Pick!
      IP3 ASSESS
      Tool - Data/mapping Tool
      Brought to you by IP3
      Staff Pick!
      State postage stamps on a blue background. White text reads
      Our Favorite State Data Tools
      Story - Original
      Brought to you by Community Commons
      Mapping and Data Tools Library
      Library
      Brought to you by Community Commons
      A blue graphic with bold, white letters that read
      Our Favorite Data Sources
      Story - Original
      Brought to you by Community Commons
      Published on 04/08/2024
      Banner image for the Community Indicator Library that includes a collage of photos of people from diverse backgrounds in various community settings overlayed with a set of icons representing data elements for the Indicators contained within the Library
      Community Indicator Library
      Library
      Brought to you by Community Commons
      Published on 01/10/2024
      collage of data and mapping images from the visualization
      Making Sense of COVID-19 Data, Mapping, & Modeling Tools
      Story - Original
      Brought to you by Community Commons


      Discover important considerations for using and sharing data equitably, and practical strategies you can implement to advance data equity. Explore resources and tools to support an equitable approach to data collection, sharing, interpretation, and more. Additionally, learn how to apply specific data and mapping work to social justice issues.


      Search on Community Commons for:  Data Decolonization  |  Data Ecosystems  |  Open Data |  Open Mapping


      Screen shot of the headline of the story
      Storytelling as a Catalyst for Equitable Well-Being
      Story - Written
      Brought to you by IP3
      Train tracks running through a city. Photo by Bobby Kasimis on Unsplash
      7 Ways Spatial Inequality Compromises Health and Well-Being
      Story - Original
      Brought to you by Community Commons
      Cover of A Toolkit for Centering Racial Equity Throughout Data Integration
      A Toolkit for Centering Racial Equity Throughout Data Integration
      Tool - Toolkit/toolbox
      Brought to you by University of Pennsylvania
      Lego people in progress pride flag colors
      Counting All in Our Communities: Sexual Orientation and Gender Identity Data
      Story - Original
      Brought to you by Community Commons
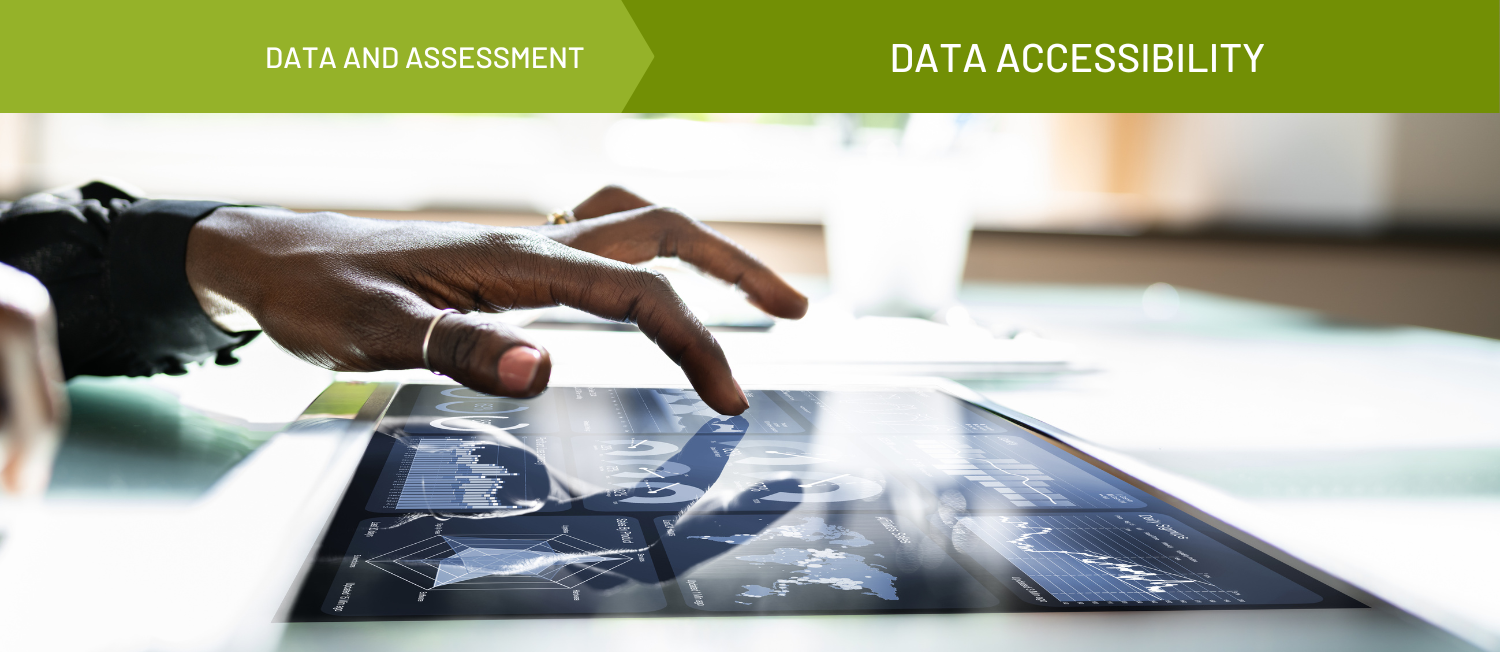
      A photo of a person looking at data on a tablet. A green banner spanning the top of the image reads
      Data Accessibility
      Topic - Data & Assessment
      Photo of Indigenous carving. A teal banner spanning the top of the image reads
      Indigenous Knowledge
      Topic - Possibilities
      Photo of two people looking at and discussing data on a tablet and on paper.
      Data Sharing
      Topic - Possibilities
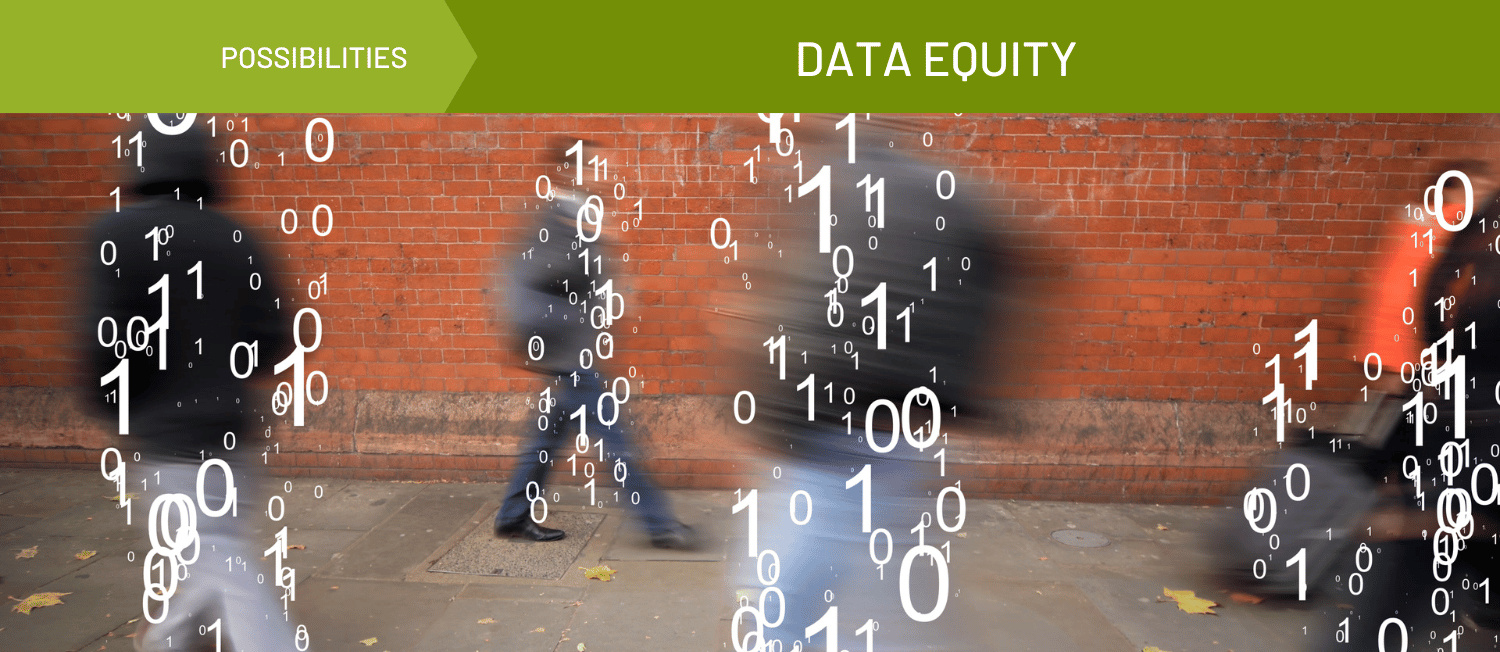
      A photo of people walking past the camera, overlaid with binary code. A green banner spans the top of the image and reads
      Data Equity
      Topic - Possibilities
      of photo of a person or persons split into six sections with coding or data overlays
      An Introduction to Data Equity
      Story - Original
      Brought to you by Community Commons


      More Mapping and Data Resources


      Home page of CARES Vulnerable Populations Footprint tool
      SparkMap Vulnerable Populations Footprint
      Tool - Data/mapping Tool
      Brought to you by CARES
      Purple States of America
      Resource - Map
      Queering the Map
      Queering the Map
      Tool - Data/mapping Tool
      Brought to you by Queering the Map
      Staff Pick!
      Native Land
      Native Land
      Tool - Data/mapping Tool
      Brought to you by Native Land Digital
      Inclusiveness Index: Results
      Tool - Data/mapping Tool
      Brought to you by Othering and Belonging Institute
      Cover of PDF Report: Data Walks: An Innovative Way to Share Data with Communities
      Data Walks: An Innovative Way to Share Data with Communities
      Tool - Data/mapping Tool
      Brought to you by Urban Institute
      Screen shot of the homepage
      PLACES: Local Data for Better Health
      Dataset
      Brought to you by CDC


      Suggestions?

      We would love to hear from you! Please click the button below to suggest a resource.


       Related Topics


      Card image
      Data Equity

      Card image
      Geospatial Data

      Card image
      Seven Vital Conditions for Health and Well-Being

      Card image
      Community Health Improvement Plans

      Card image
      Data Granularity

      Card image
      Monitoring and Surveillance

      Card image
      Community Health Needs Assessment

      Card image
      Data Visualization

      Card image
      Administrative Data

      Card image
      Demographic Data

      Card image
      Data Sharing

      Card image
      Surveys

      Card image
      Community Needs Assessment

      Card image
      Focus Groups

      Card image
      Indigenous Knowledge