Disaggregating Population Health Measures
This feature was originally published on the IP3 Blog and is being reproduced for Community Commons with permission of the Institute for People, Place, and Possibility.
Disaggregating Population Health Measures
Access to the vital community conditions for health and well-being differs across places and populations. Disaggregating data—by geography (e.g., county, neighborhood), demographic group (e.g., age, gender, race, and ethnicity), or by other subpopulations—helps identify underlying patterns of variation.
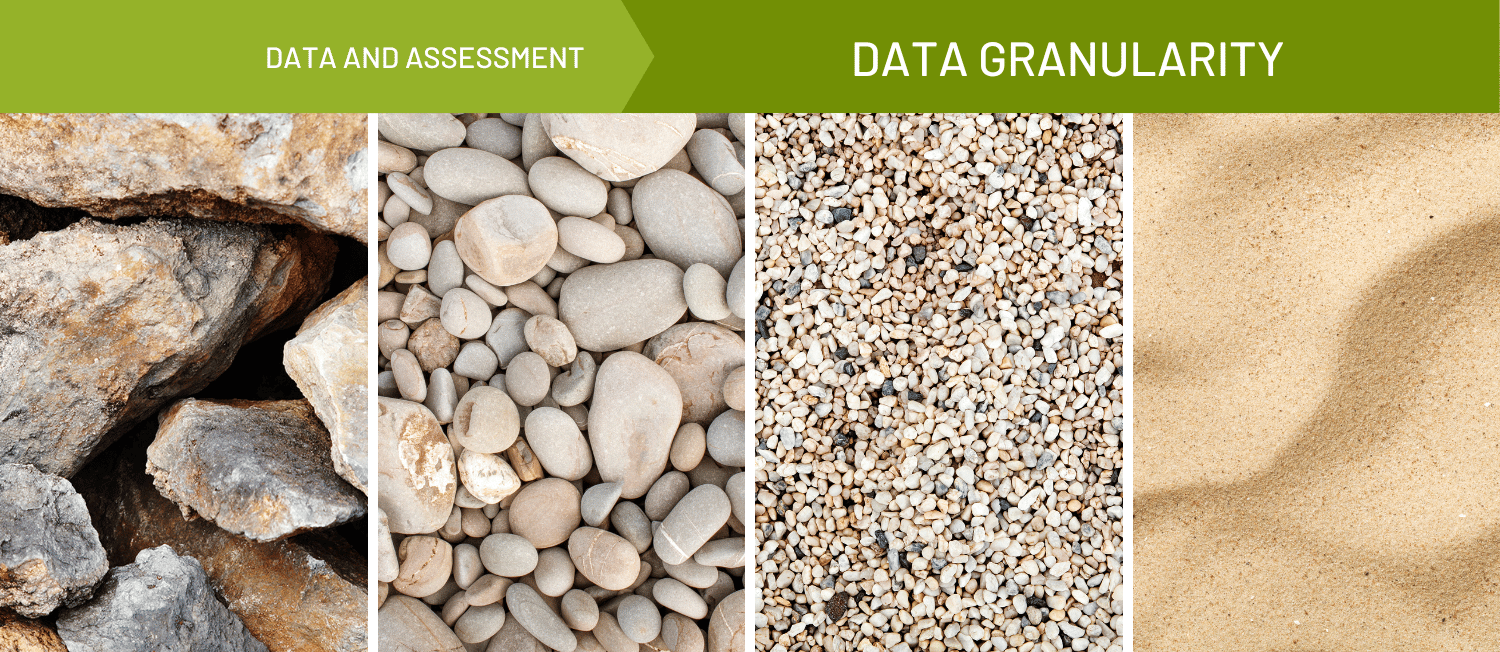
Call out: Disaggregating data refers to the process of breaking down aggregated data into smaller informational units in order to examine a characteristic or dimension.
For example, we can “break down,” “disaggregate,” or “stratify” health outcome or behavior data (such as cancer incidence or receiving a flu shot) by race and ethnicity to gain clarity on existing disparities and examine issues of health access and opportunity in communities of color. Disaggregating data provides an additional layer of information that helps to focus health improvement efforts that minimize disparities and leverage investments to advance equity.
Explore an Example
Disaggregating poverty data allows us to see areas of concentrated poverty and the disproportionate impacts of poverty on certain priority populations. Use the interactive visualization below to examine disaggregated poverty data in your County.
The map on the left displays the percentage of the population for whom poverty is determined who are below the Federal Poverty Level for each Census Tract within a County; the bar graph on the right shows the percentage of the population for whom poverty is determined who are below the FPL by race (e.g., Asian and Asian Americans, Multiracial), ethnicity (e.g., Hispanic and Latinx), and age group (e.g., Older Adults).
In Boone County, Missouri (the default geographic selection) we can see that poverty is concentrated in certain parts of the county’s urban core–the City of Columbia (IP3’s hometown!). We also see that higher proportions of Black and African American people and Native Hawaiian and Pacific Islander people experience poverty than other groups. These insights can help guide community stewards when making decisions about how and where to best invest time, resources, and programming to advance equitable well-being.
For example, geographic insights about poverty can inform decisions about siting community services or prioritizing transit and affordable housing investments in low-income neighborhoods. Information about groups that are disproportionately affected can inform program planning and evaluation activities, community engagement priorities, and outreach and communication efforts. By using disaggregated data, community stewards can make better decisions, leading to effective, efficient, and sustainable change.
Characteristics of Disaggregated Data
In order to explore disaggregated data for geographies or subpopulations of interest, we must collect the appropriate data. To see data disaggregated by geography, geographic identifiers must be present in the dataset. To see data disaggregated by demographic group or other subpopulations, relevant demographic variables must be present in the dataset.
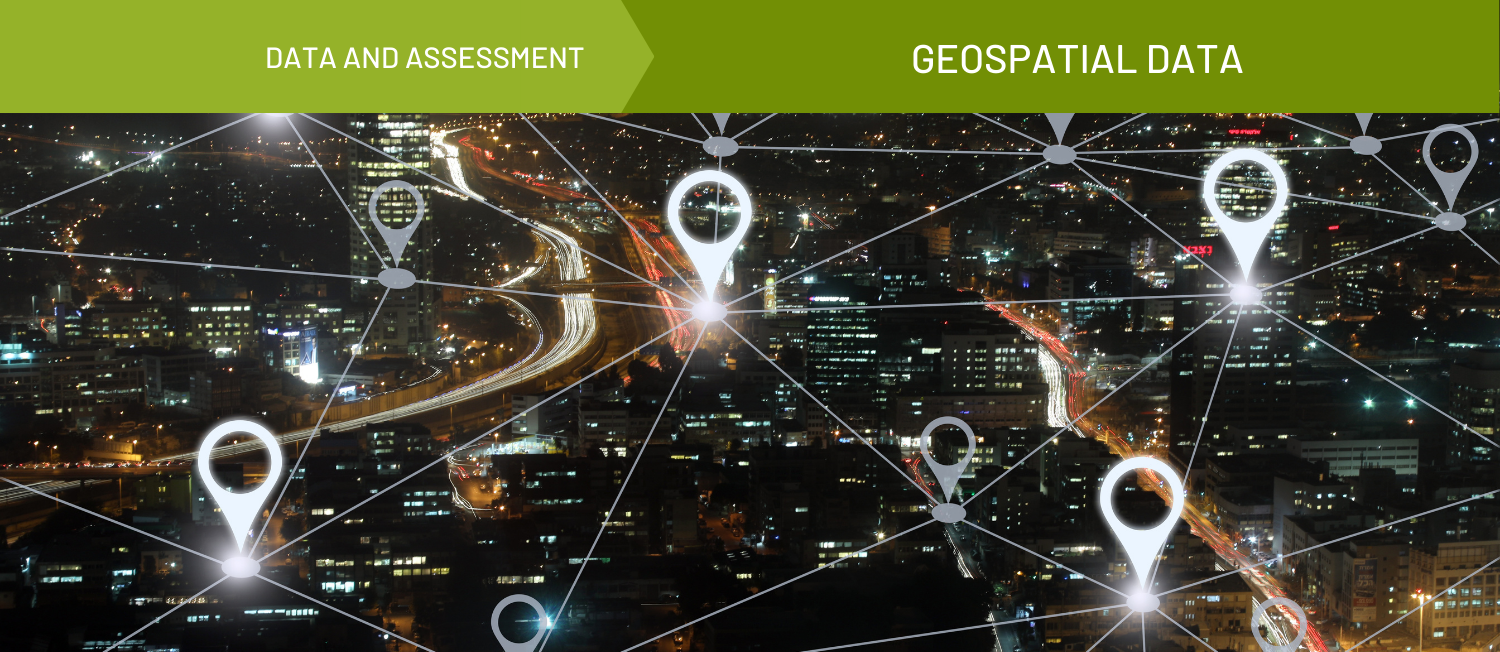
Geographic Identifiers
Disaggregation by geography is possible with geospatial data. Geospatial data refers to location-based data, which are often displayed on a map but can be used in many ways and facilitate geographic and location-based analyses. Geospatial data require geographic identifiers, like addresses or latitude/longitude coordinates, or geographic entities, such as States, Counties, Census Places (e.g., Cities), Census Tracts, and Census Block Groups. In the embedded visualization above, values for individual Census Tracts within a County are displayed on the map.
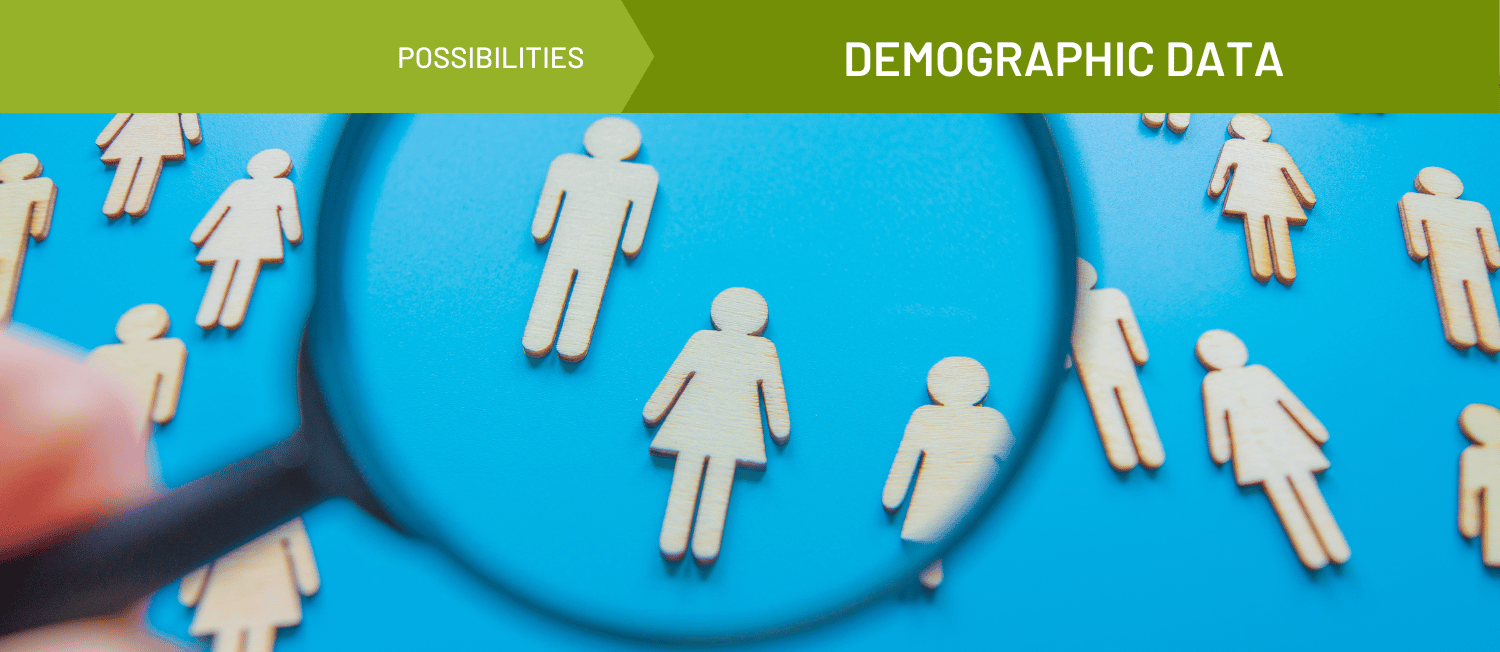
Demographic Variables
Disaggregation by demographic group or sub-population is possible when relevant demographic variables are available. Demographic variables are variables or factors such as age, gender, or race, used in the study of human populations. In the embedded visualization above, values for various demographic groups are displayed on the graph. Demographic variables are often 1) self-reported from individuals in a population of study or 2) derived from administrative records.
Self-reported information - Data collection methods like surveys, focus groups, and interviews typically collect information from individuals within a study population through questionnaires, which may contain a set of demographic questions that may ask respondents about race, ethnicity, gender, age, and more. These elements can then be used to support data analysis for specific subpopulations. Note that definitions of demographic classifications may not be consistent from source to source due to differences in data collection.
Derived from records - Certain datasets, like vital records, patient health records, and administrative records of social service agencies, may use methods other than self-report to derive demographic variables. For example, age may be calculated from birthdate data. Sometimes demographic variables are derived from observations as well, for example, preferred language spoken.
Related Topics