Growth or Decline: Understanding How Populations Change
- Published Date
- 12/22/2016
- Published By
- Community Commons
This article was written by Luke T. Rogers and C. Peter Borsella for Random Samplings, the official blog of the U.S. Census Bureau. The original article can be found here.
With the release of the 2015 county and metro/micro area population estimates and components of change, we can explore the question – how did the United States population change in the last year? Demographers, researchers who study population change, begin to answer this question by looking at the components of change. There are three components of change: births, deaths, and migration. The change in the population from births and deaths is often combined and referred to as natural increase or natural change. Populations grow or shrink depending on if they gain people faster than they lose them. Looking at an area’s unique combination of natural change and migration helps us understand why its population is changing, and how quickly the change is occurring.
Natural Increase
Natural change is the difference between births and deaths in a population. Often times, natural change is positive, which means that more babies are being born than people are dying. This positive natural change is referred to as natural increase. Examples of natural increase exist across the United States, one being the Salt Lake City metro area in Utah. Between 2014 and 2015, Salt Lake City had around 19,100 births and 6,400 deaths. Since there were about 12,700 more births than deaths, Salt Lake City had a natural increase of about 12,700 people, making natural increase a key reason why its population grew over the year.
The opposite of natural increase is called natural decrease, where more people are dying than babies being born, which can cause a population to shrink. Areas with aging populations often have natural decrease. Two states had natural decrease between 2014 and 2015, Maine and West Virginia. Between 2014 and 2015, Maine had 450 more deaths than births and West Virginia had 940 more deaths than births. In both cases, natural decrease was one of the reasons why their populations shrank between 2014 and 2015 in our latest estimates.

Migration
Migration is the movement of people from one area to another. It is often expressed as net migration, which is the difference between how many people move into and out of an area. When net migration is positive, a population has more people moving in than out. We split migration into domestic migration and international migration.
Domestic migration refers to people moving between areas within the United States, and is often one of the largest contributors to population change. Regionally, the South gains the most net domestic migrants, with roughly 440,000 more people moving into southern states than leaving them between 2014 and 2015. Sometimes net domestic migration is negative, in which case more people are moving away than are moving in. The Chicago metro area in Illinois, Indiana, and Wisconsin lost about 80,000 people through migration between 2014 and 2015, which is consistent with a long-standing pattern of negative net domestic migration for the metro area.

International migration refers to people moving into and out of the United States, and consists of a diverse group of people such as foreign-born immigrants from many countries around the world, members of the U.S. Armed Forces, and U.S. citizens working abroad. Some areas, like the Miami metro area in Florida, grow (in part) due to net international migration. Miami gained about 70,000 net international migrants between 2014 and 2015, making net international migration a major factor in Miami’s population growth.

The Big Picture
Analyzing the components of change is an enlightening way to understand how the U.S. population is shifting over time. Looking at counties across the country, we can identify clusters of counties that grow mainly due to migration and others that grow due to natural increase. Clusters seen in areas like Florida and Texas, which grew primarily due to net migration gain between 2014 and 2015, are visible in Map 1. Other clusters shown in Map 1, such as those in California, Utah, and along the east coast from Virginia up to New York, grew over the same span of time in large part due to natural increase.

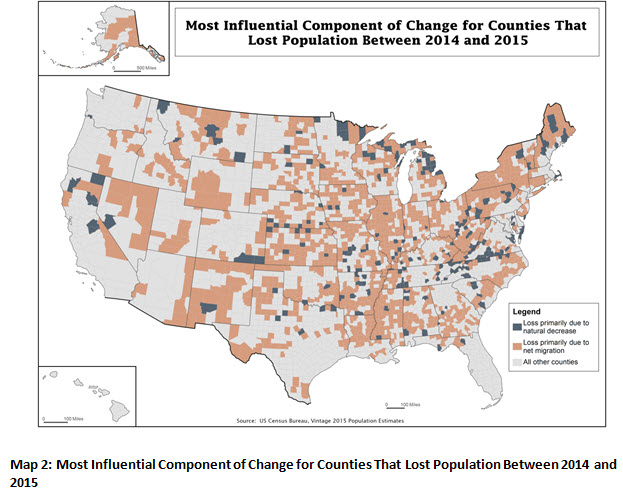
Counties with shrinking populations are also clustered geographically. For many of these shrinking counties, net migration is the primary cause of population loss. How these counties can cluster together is shown in Map 2, where several areas along the Mississippi River (Arkansas, Louisiana, and Mississippi) had net migration loss between 2014 and 2015. States like Illinois, Kansas, New Mexico, and New York also had several counties that lost population due to net migration loss. Areas that declined mainly due to natural decrease are similarly clustered, as seen along the Virginia/North Carolina border and in northern Michigan.
Natural change and net migration both contribute to population change, sometimes with unexpected results. Frequently, natural change and net migration push a population in opposite directions, making it more difficult to determine whether a population is growing or shrinking. Los Angeles County, California—the largest county in the United States—experienced both natural increase and net migration loss between 2014 and 2015. As noted earlier, natural increase contributes to population growth, while net migration loss can cause a population to shrink. This can beg the question, how might a population change when subjected to seemingly contradictory components? The answer is that it depends. In the case of Los Angeles, the growth due to natural increase was much larger than the loss due to net migration, and the county saw a sizeable population increase. All across the United States, stories like the one playing out in Los Angeles exist, with each area having a unique combination of natural change and net migration that determines whether they grow or shrink from year to year. By looking at these basic components of population change, demographers gain insight into the complexities of how populations change over time.
“Summing” It All Up
Overall, population grows or shrinks through two very basic components – natural change (births minus deaths) and migration (domestic plus international). As illustrated in this blog, the balance between these components is unique in each area, while following general patterns across states or regions. This balance gives areas their own unique story as they change over time. Through the production of annual population estimates, and the types of analysis provided here, demography continues to be an important, ongoing focus of study at the Census Bureau that contributes to our understanding of where we’ve been and where we’re headed in the future.
_____________________________________
The Office of Management and Budget’s statistical area delineations for metro areas are those issued by that agency in February 2013. Metro areas contain at least one urbanized area of 50,000 or more population, and consist of one or more whole counties or county equivalents. Some metro area titles are abbreviated in the text of the blog.
The Census Bureau develops annual population estimates by measuring population change since the most recent census. The Census Bureau uses births, deaths, administrative records and survey data to develop estimates of the U.S. population. For more details regarding the methodology, see https://www.census.gov/programs-surveys/popest/technical-documentation/methodology.html
View Story
