Understanding and Interpreting Population Health Measures
This feature was originally published on the IP3 Blog and is being reproduced for Community Commons with permission of the Institute for People, Place, and Possibility.
Understanding and Interpreting Population Health Measures
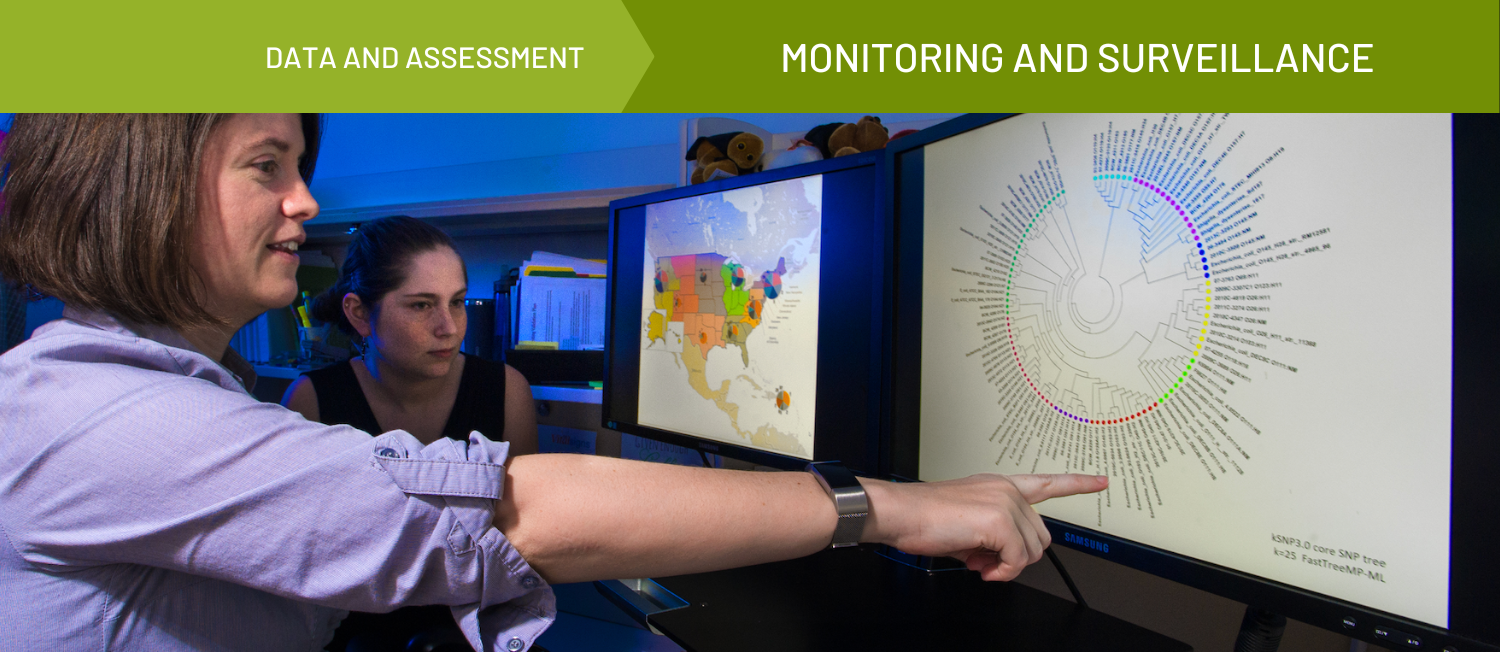
Population health measures give us the information we need to assess and improve community health. They help us answer the questions we have about communities by quantifying health and well-being outcomes, community conditions, and other factors. For example, if we are curious about the overall health of our communities, we might look at the infant mortality rate, the proportion of people living in poverty, and median household income—these measures help paint a picture of community health.
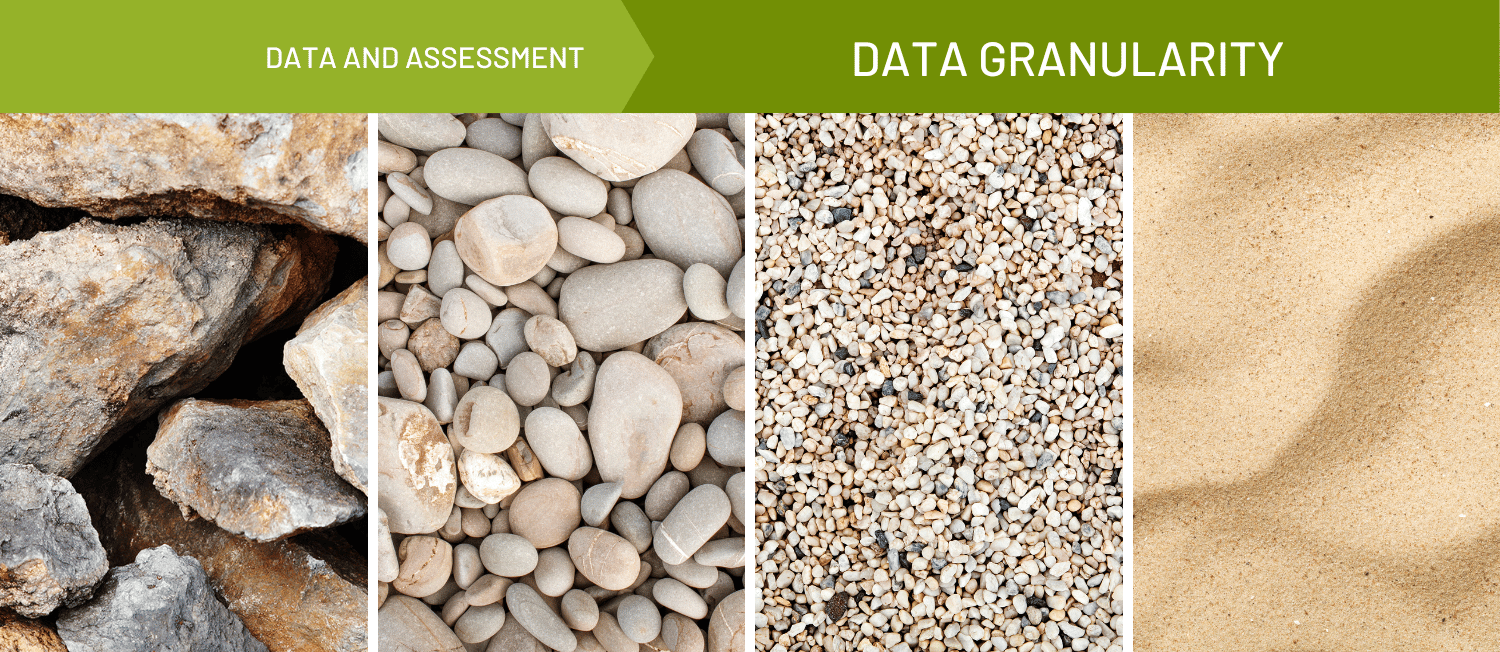
Many common population health measures either a) summarize a distribution, like means and medians, or b) characterize a part of a distribution, like ratios, proportions, and rates. Here, “distribution” refers to a set of data from which we can generate information, for example, survey responses, test scores, daily recorded temperatures, and case counts. We use population health measures—specific measures of the distribution—to make sense of data. Learning to interpret community health measures requires a foundational understanding of what the different measure types indicate and how they can be used. Here, we summarize common types of population health measures—many of which are included on IP3 ASSESS— and give examples of how they are applied. It’s important to interpret community health measures accurately in order to glean key takeaways and implications for future work to advance community well-being.
Summarizing a Distribution: Measures of Central Location and Spread
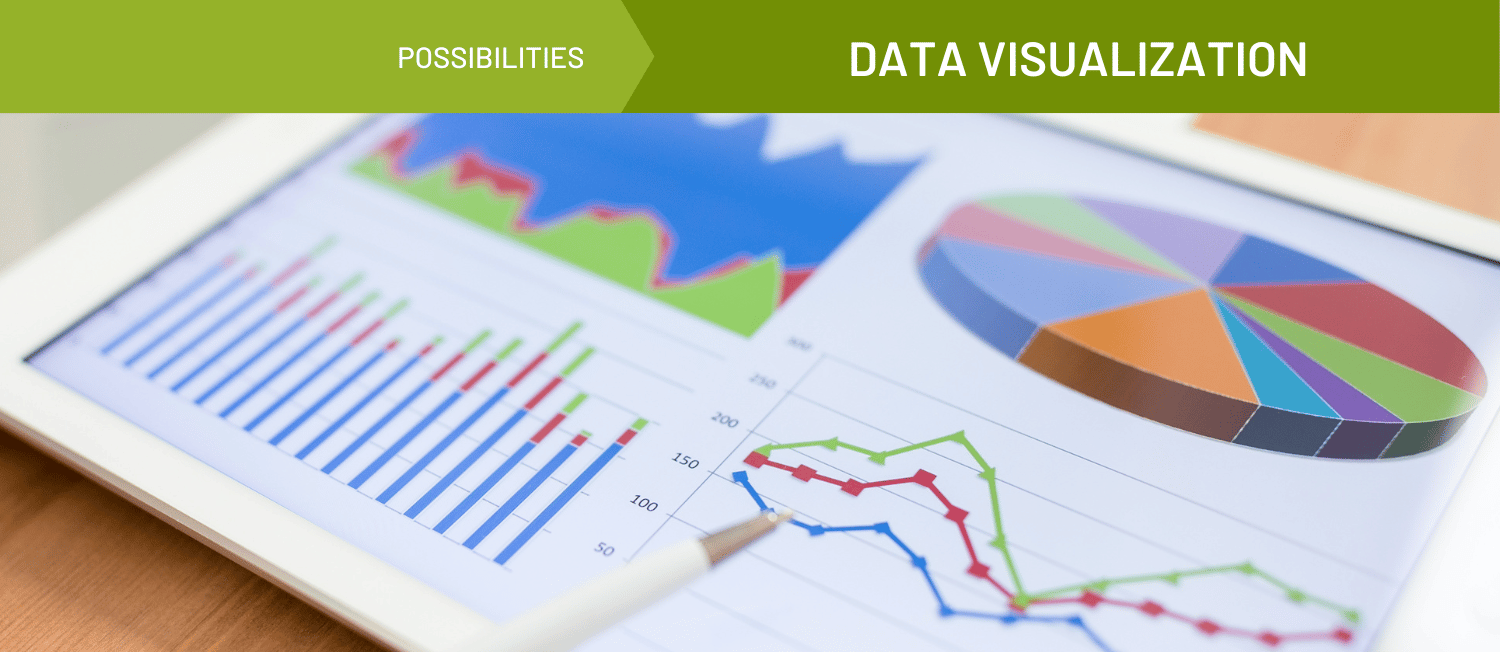
Measures of central location and spread are useful in summarizing distribution of observations for continuous variables, which can have an unlimited number of values between the lowest and highest points of measurement. Measures of central location like mode, mean, and median describe where the peak—the center—of observations is located. Measures of spread or dispersion, like standard deviation, percentile, quartile, and range, describe the dispersion or variation of values. Measures of central location and spread help us understand the contours of our distribution.
Beyond the measures described above, other measures of central location—mode, midpoint, geometric mean–and spread–range, quartiles, standard deviation, and standard error—may be important to consider in your data and measurement work.
Standard deviation is an important measure of spread and is core to the scoring methodology on IP3 ASSESS. Standard deviation tells us how widely or tightly observations are distributed from the mean. IP3 ASSESS uses standard deviations to calculate a Z-score for any given geography in the platform, which tells us how many standard deviations you are away from the mean. (Read more!)
Characterizing Part of a Distribution: Frequency Measures
Frequency measures characterize part of a distribution to another part of the distribution or to the entire distribution. Frequency measures include ratios, proportions, and rates. In contrast to measures of central location and spread, which can be used to characterize continuous variables, frequency measures are used to summarize categorical variables. They tell us how often a type of observation occurs.
Other Types of Measures
Besides measures of central location and spread and frequency measures, you’re likely to encounter a variety of other measures, including aggregate measures, summary measures, measures of disparity, and measures of association.
Weaving Data with Story and Experience
Population health measures are one piece of the puzzle in using data to drive community health improvement. There are many sources of data and different ways of knowing that are critical to consider as well. At IP3, we recommend using multiple types of data and information, including qualitative data and storytelling, to weave together a portrait of your community that is shared and iterated upon by the public, particularly by priority populations. We also encourage engaging community residents with lived experience and asking about the extent to which the population health data resonates with what life is really like in a community.
Stratifying Measures
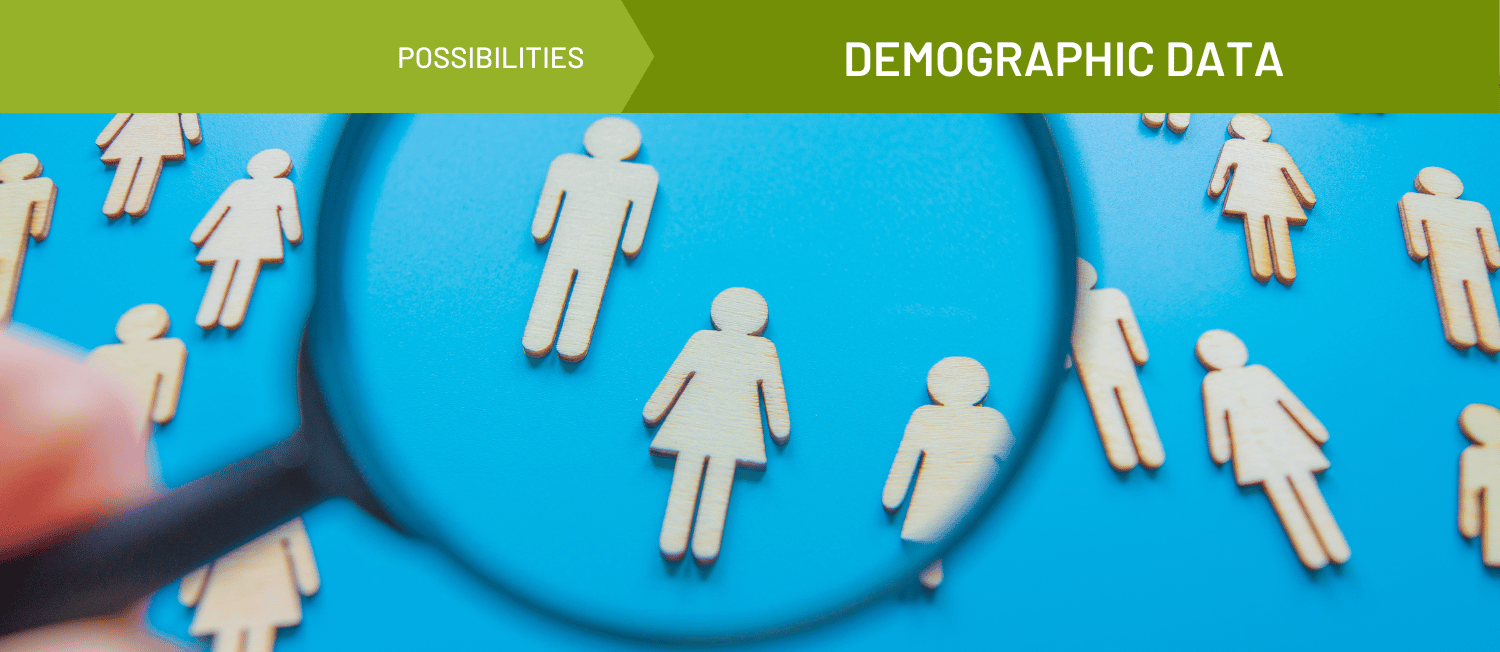
Stratifying measures by demographic groups, like race, ethnicity, gender, age and other population groups can expose important disparities. By looking at a single measure for the population as a whole, and also for groups within the population, we can identify population groups to prioritize in order to improve health equity.
Population Health Measures for Community Action
Choice of measure when exploring population health data is important—it shapes how we see the world and plan for community health improvement. For example, IP3 recently helped a client select ACES (Adverse Childhood Experiences) data for their assessment work. IP3 zeroed in on two potential ACEs measures: (1) Mean number of ACEs reported by adults, and (2) Proportion of adults who report four or more ACES. The mean reports, on average, how many ACEs an adult experienced, while the proportion indicates how large the group with severe exposure to ACEs in a given community is. This client wanted to prioritize severe ACEs in their assessment and selected the proportion for their framework. The types of measures selected shape how a community is seen and gives direction for taking action. Selecting and interpreting appropriate population health measures is imperative to using data to inform and drive strategies to advance equitable well-being.
Additional Resources

Related Topics